Examples
← Home
Treemap
--output treemap.svg produces an interactive SVG — hover over any tile to see the full path and size in a floating tooltip, and CSS highlights show the hovered tile.
dirplot map src/dirplot --log-scale 4 --output treemap.svgdirplot map . # current directory, opens in viewer
dirplot map . --inline # display in terminal (iTerm2/Kitty/Ghostty)
dirplot map . --output treemap.svg # interactive SVG with hover tooltips
Log scale
By default tile area is proportional to file size. When one file or directory dominates, everything else shrinks to tiny slivers. --log-scale compresses the size range so smaller files remain visible.
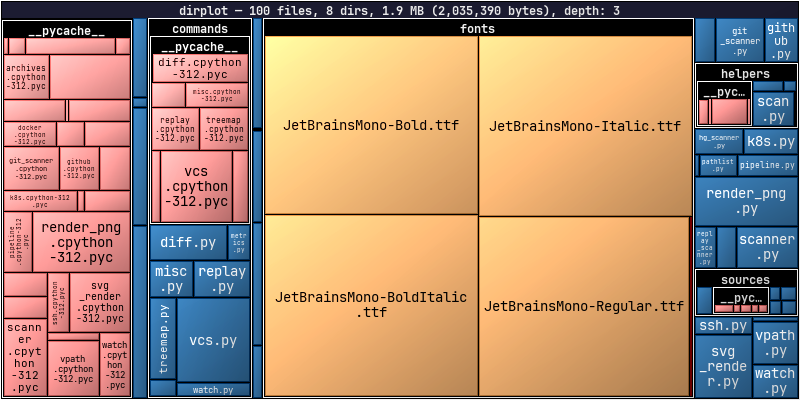
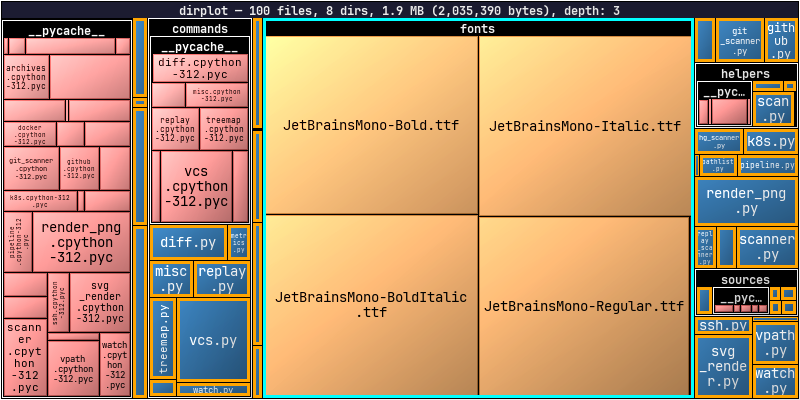
dirplot map src/dirplot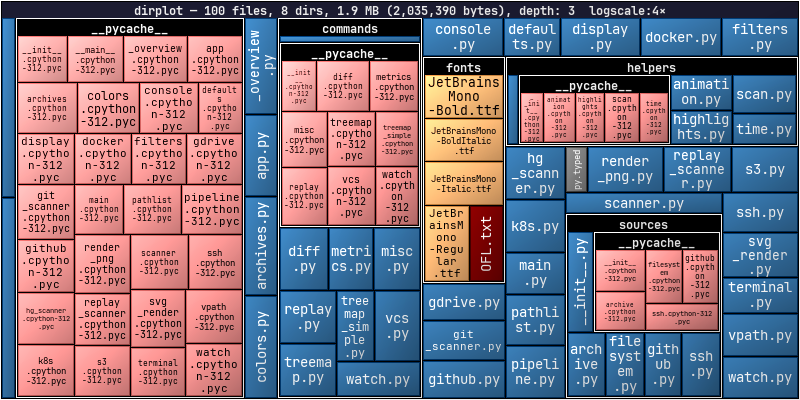
dirplot map src/dirplot --log-scale 4Archives
dirplot reads archive files directly as treemap inputs — no unpacking needed. Sizes come from the uncompressed sizes stored in the archive metadata. See Archive Formats for the full list of supported formats.
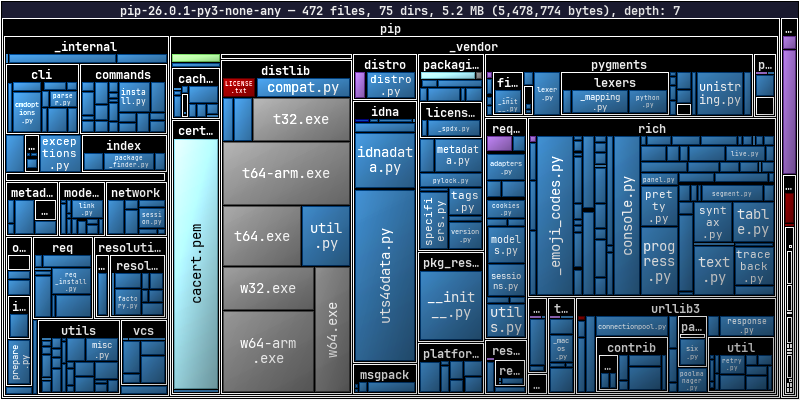
dirplot map pip-26.0.1-py3-none-any.whlDiff
Colour-coded borders show what changed between two trees: green = added, red = removed, blue = modified. Works with any two sources — directories, commits, archives, GitHub tags, S3 prefixes, containers.
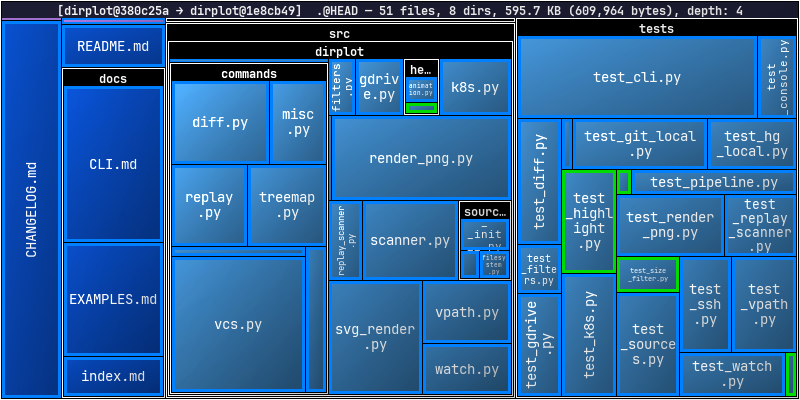
dirplot diff .@HEAD~50 .@HEAD --changed-onlydirplot diff . # uncommitted changes in current repo
dirplot diff .@HEAD~5 .@HEAD # last 5 commits
dirplot diff old/ new/ # two local directories
dirplot diff github://owner/repo@v1.0 github://owner/repo@v2.0
dirplot diff release-1.0.tar.gz release-2.0.tar.gz
Highlighting
The --highlight/-H flag draws coloured borders around matching files or directories. Patterns support * and ** globs; append @color to pick a colour (defaults to red). Works on map, diff, git, hg, and replay.
dirplot map . --highlight "src/main.py"                    # single file, red
dirplot map . --highlight "**/*.py@orange"                 # all Python files
dirplot map . --highlight "src@orange" --highlight "**/*.md@cyan"
dirplot map src/dirplot --highlight "**/*.py@orange" --highlight "src/dirplot/fonts@cyan"Colours accept any CSS name (red, orange, lime, cyan, #ff8800, …). Both PNG and SVG output are supported.
Metrics
dirplot metrics prints file/dir counts, total size, depth, top extensions by count or size, and the largest files and directories with their share of total size.
dirplot metrics .
dirplot metrics . --sort-by size           # sort extensions by bytes
dirplot metrics . --top 5 --json           # JSON output, top 5 per list
dirplot map . --metrics --no-show          # treemap + metrics in one pass
Remote Sources
dirplot scans remote trees without downloading files. See Remote Sources for authentication, options, and full reference per backend.
dirplot map github://pallets/flask
dirplot map s3://noaa-ghcn-pds --no-sign --depth 2
dirplot map ssh://alice@prod.example.com/var/www
dirplot map gdrive://                      # Google Drive (requires gog)
dirplot map docker://my-container:/app
dirplot map pod://my-pod:/app
Git & Mercurial History
Animate a repository's commit history as a treemap — one frame per commit, with colour-coded borders showing what changed. Mercurial is equally supported via dirplot hg. See dirplot git and dirplot hg for the full options reference.
dirplot git . --output snapshot.png                        # snapshot of HEAD
dirplot git . --range main --output history.mp4            # full history as MP4
dirplot git . --period 30d --total-duration 20 --output history.mp4
dirplot git github://owner/repo --range v1.0..v2.0 --output release.mp4

dirplot hg . --range 0:tip --output history.png            # full Mercurial history
dirplot git https://github.com/steipete/birdclaw --canvas 1000x600 --range main -o steipete-birdclaw.mp4To animate real-time filesystem activity, record with dirplot watch and replay with dirplot replay: